
Coincidence mapping biological records

Right now the interest in QGIS amongst biological recorders and conservationists seems almost insatiable. Yesterday I was very pleased to deliver a day's workshop on QGIS and the Tom.bio QGIS plugin for members of Lancashire Wildlife Trust's (LWT) conservation team. There was added interest for me because Lancashire is my home county and, as well as being a member of LWT, I also sit on its Conservation Committee. (I am also a member of the Shropshire Wildlife Trust - I consider myself lucky to be able to split my time between two such beautiful and biologically diverse counties.)
It was gratifying that those on the course - many of whom I knew from my time with Merseyside BioBank LERC - were so quick on the uptake and could see the potential of QGIS and the Tom.bio plugin in their own work areas. Rachel Miller - Red Squirrel Project Officer for the trust - used the Tom.bio Biological Records tool to produce a couple of maps, from her own records, of Red and Grey Squirrels around the Sefton Coast. She asked me if there was a way to use the tool to make a coincidence map for the two species. Well I had to admit that there wasn't really.
But I had a think about it and I realised that it would be very easy to modify the tool to make this possible. So today I published a new version of the QGIS Tom.bio plugin that enables this. This video explains how to use the tool and QGIS' styling features to create a coincidence map.
(To view full-screen view it on YouTube - click bottom right of the video - and view full-screen from there.)
The example in the video illustrates a coincidence map for two species of Tegenaria house spiders T. gigantea and T. saeva. These two species are very closely related; indeed some recent work suggests that they should be considered as one species. In the UK T. gigantea has a mostly eastern distribution and T. saeva has a mostly western distribution. There is a zone in the West Midlands - including Shropshire - where they overlap. So for Shropshire arachnologists, this coincidence map has particular interest.
The reason for Rachel's interest in the coincidence of records for Red and Grey Squirrels in West Lancashire and Merseyside needs no explanation. I hope that the enhancement to this tool helps her and other conservationists with their work. Rachel turned up to yesterday's training with an orphaned Red Squirrel which she was nursing until it can be released - a rather cute reminder, if any were needed, of why we were all there.
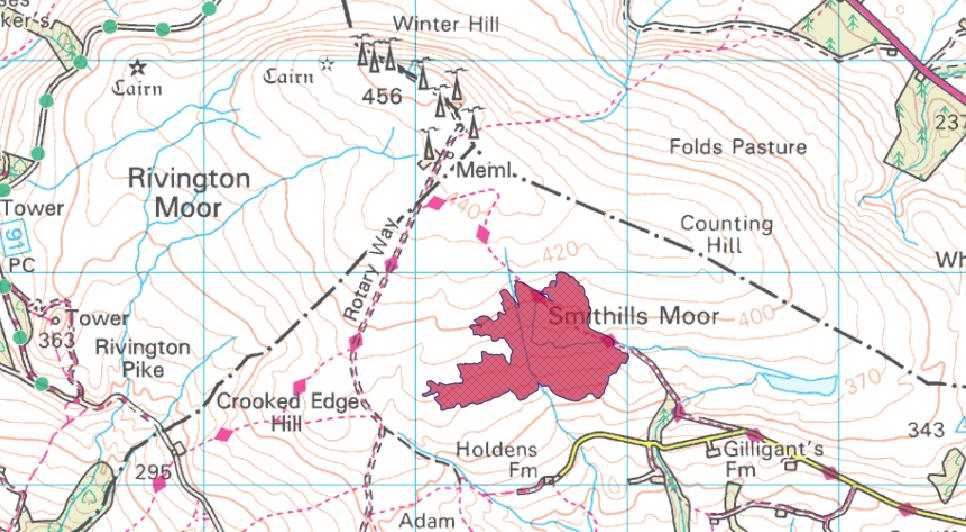
On my way home there was a much grimmer reminder of why competence with spatial data, and the technology that deals with it, is important to conservationists: as I drove down the M61 I could see smoke coming from what could only be a huge fire on the West Pennine Moors close to where I live. The BBC News later in the evening confirmed that a fire extended over some 50 hectares of moorland. The devastation to the wildlife up there at this time of year will have been huge. I'm not particularly looking forward to going up there to examine the damage. But go I will and I'll take my GPS to map the extent of it as I have done after previous moorland fires there.
We live in an increasingly crowded world where we must argue the case for conserving biodiversity on virtually every scrap of land. As conservationists we can only do that if we arm ourselves with information and evidence that is becoming increasingly spatially referenced. Competence with GIS is a vital element in that.
Postscript 13th June 2015
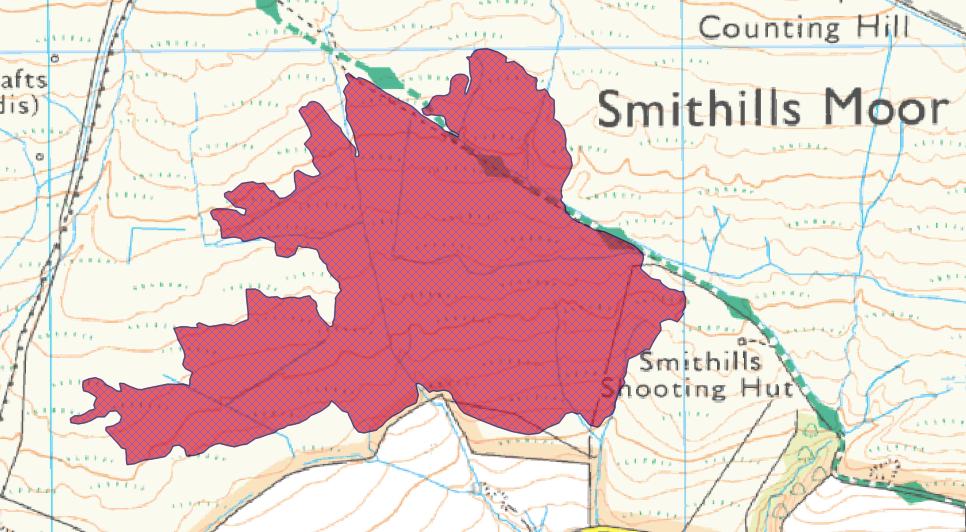
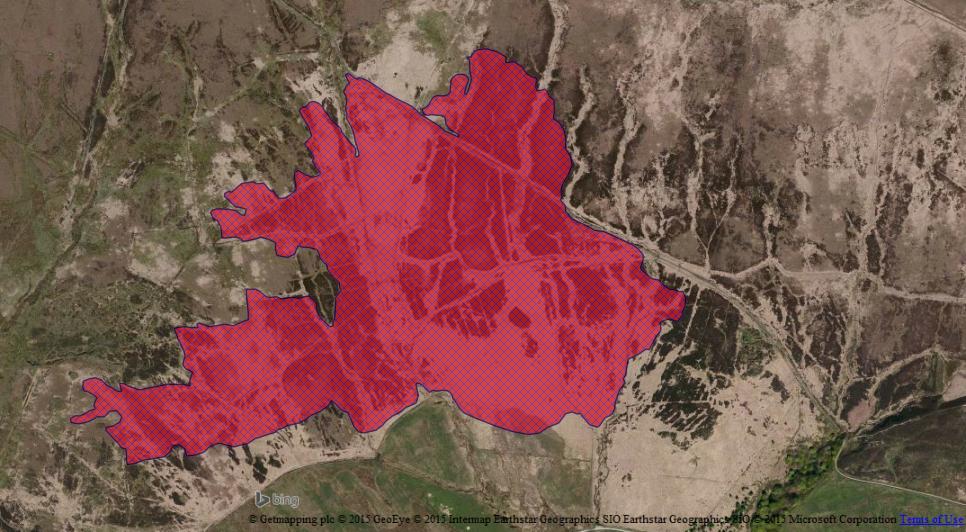
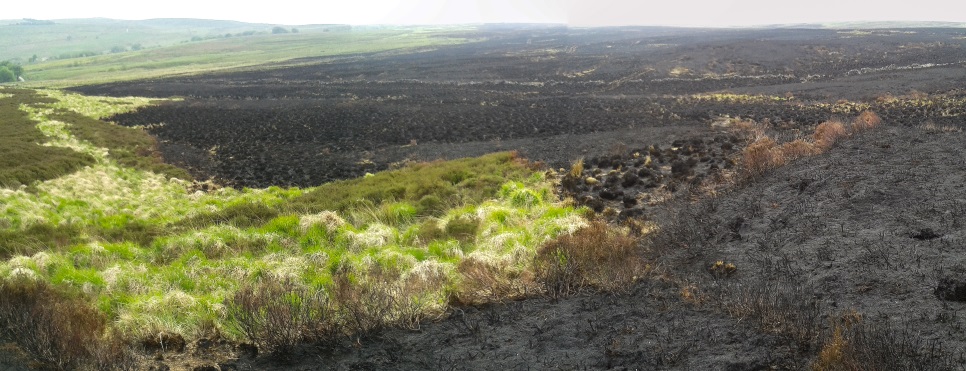
I visited the site of the fire today and walked the perimeter of the burn recording, as I went, my track using a smartphone app. From the resulting GPX track files which I opened in QGIS I created this polygon showing the extent of the burn on Smithills Moor. QGIS tells me that the actual extent is 30.5 hectares. The burn appears to have been fairly superficial with no sign that it has penetrated deeply into the peat although clearly many small mammals, probably some common lizards and many ground nesting birds will have perished, particularly the nestlings of Meadow Pipits and Skylarks. If anyone would like the shapefile showing the extent of the burn, drop me an email.
- rich burkmar's blog
- Log in or register to post comments

Comments
tm2383 (not verified)
Sun, 28/06/2015 - 20:10
Permalink
Irish Grid Reference
I'm curious to know if anyone here uses Quantum GIS with the Tom-bio plug in to plot distribution maps. It doesn't have an option to plot co-ordinates from the Irish Grid System. The only work around I have found online seems to be to convert the grid reference to Eastings and Northings in the spreadsheet you import but I don't know if there is an easy way to do this. Is there a straight forward formula for doing this that can be used in Excel?
rich burkmar (not verified)
Mon, 29/06/2015 - 07:08
Permalink
Irish GRs
tm2383 (not verified)
Sun, 28/06/2015 - 20:21
Permalink
The first line should have
The first line should have read: I'm curious to know if anyone here uses Quantum GIS with the Tom-bio plug in to plot IRISH distribution maps.